Power BI is a powerful tool which helps us to create quick and interactive insights from wide range of data sources. Here we’ll be discussing about Power BI service which is a SaaS, and how to embed Power BI Dashboards, Reports and Tiles in web applications. If you are new to Power BI, you can start here.
Power BI can be embedded in an application by two ways:
-
Embedding for customers — This is for embedding dashboards and reports to user who don’t have Power BI account. Power BI API’s are invoked based on the application’s master account and the reports/dashboards are made available to the users of the application.
-
Embedding for your organization — This is for embedding dashboards/reports for the users in your organization, who have Power BI accounts.
Update on 30th January 2019: There is a new option that enables business users who do not have any coding skills to easily and securely embed reports in internal web portals. Users viewing the embedded report need either a Power BI Pro license or the content needs to be in a workspace that’s in a Power BI Premium capacity (EM or P SKU). More information is available here.
Microsoft provides sample .net applications for both ways. The source code is available here, well and good. But how to embed reports/dashboards in popular JavaScript frameworks?
There weren’t much tutorials available on-line, and I was bit confused with the distinction between the above two approaches. But I was not alone in this pursuit, someone have already figured out the “Embedding for customers” and it was really helpful. I wasn’t satisfied with that and after spending a couple of days in Power BI forums and GitHub repositories, I’ve finally figured out how to do it both.
This is the first part of the two-part article series. You can find the second one here.
Embedding for Customers
Creating dashboards/reports using Power BI are out of scope of this article, you can learn more about it here. I’ve skipped a lot a details which have better documentation elsewhere.
Contents
- Prerequisite
- Overview
- Set up your embedded analytics development environment
- Set up your Power BI environment
- Create a Web API
- Create Angular client
- Conclusion
Prerequisites
- Power BI pro account
- Microsoft Azure Subscription
- Azure Active Directory Tenant Setup. If it is already done for your organization, you can find it here.
- Visual Studio (2013 or later)
- Visual Studio Code
- npm, node, angular-cli
Overview
A high level diagram showing how this works is shown below.
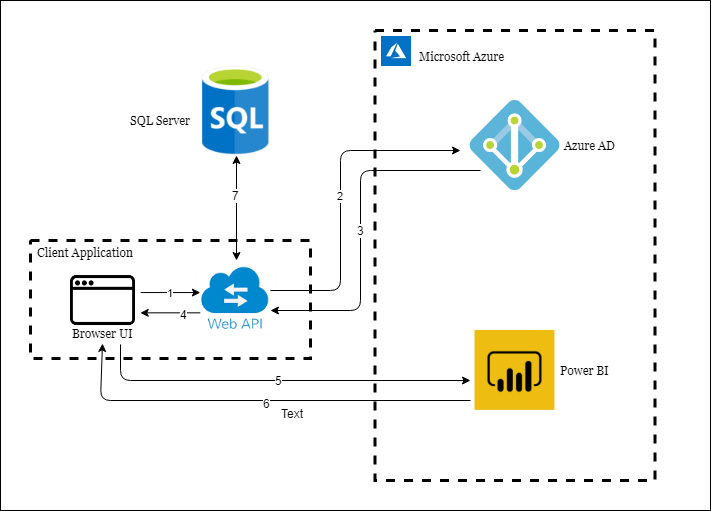 Embedding for customers
The work flow is as follows.
- When user browse UI, it invokes API for embed token.
- API authenticates application using master account credentials and request for tokens.
- Azure AD returns token on successful validation, else reject the request.
- Embed token is returned to UI from API.
- UI calls Power BI API to get the report specific data with the token.
- Power BI API returns report data, and UI displays it in the web page.
- (Optional) User authorization via custom roles stored in the SQL server (or by any other means).
Set up your embedded analytics development environment
Refer this for more details.
Since we are using Web API, redirect URL don’t have much significance.
Set up your Power BI environment
Refer this for more details.
Create a Web API
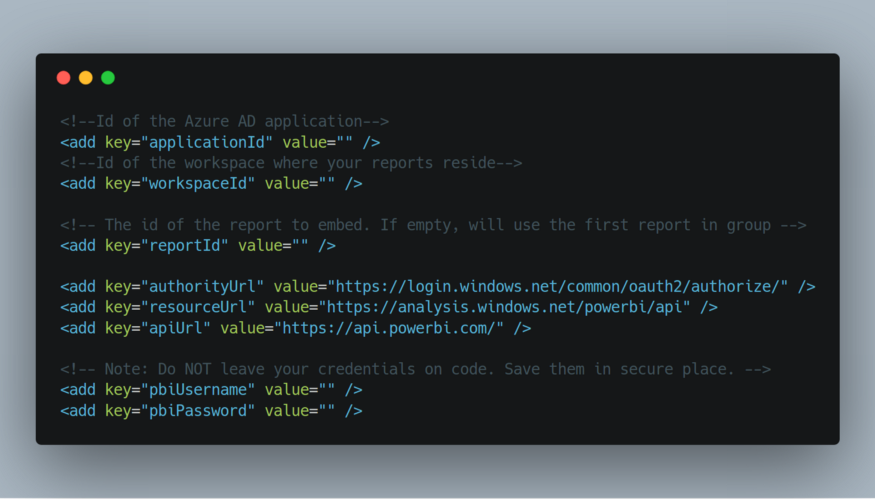
If you are new to Web API’s, you can start here. In the Web.config file we need to add few key-value pairs. Here you need to provide your master account’s username and password.
 Gist: https://gist.github.com/krishnaanaril/fdec1fe979dd353cd04bb86474e387e3
You’ll get ‘applicationId’, ‘workspaceId’ and ‘reportId’ during Power BI setup. Now we need to define the token objects to be returned from the methods.
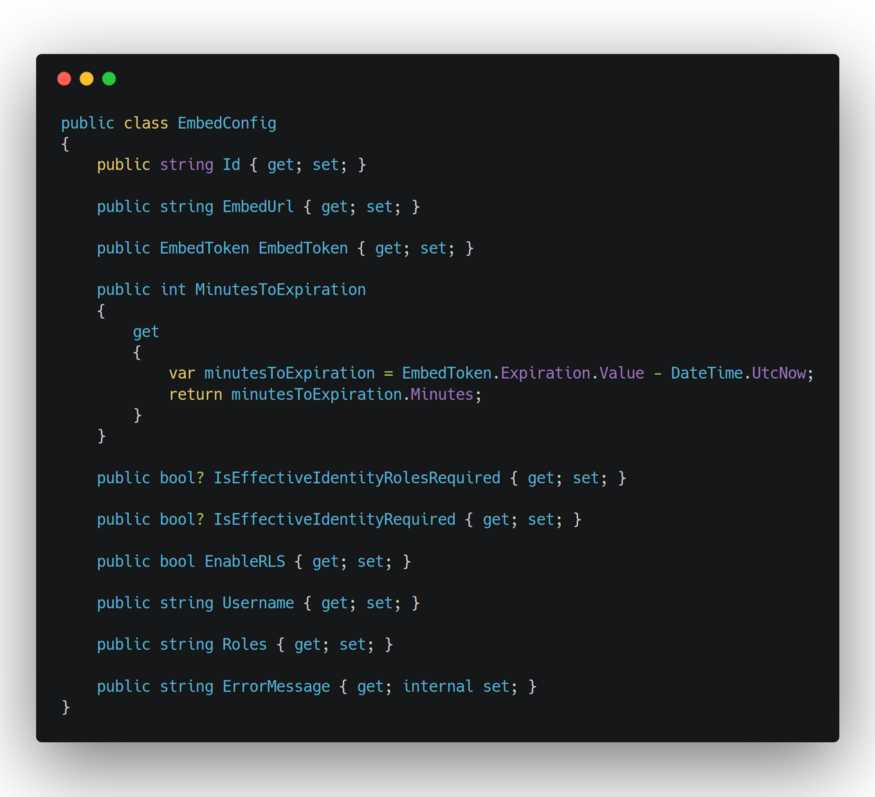 Token object for Dashboard/Reports. Gist: https://gist.github.com/krishnaanaril/5e56889f072a2606c1da0646766501dc
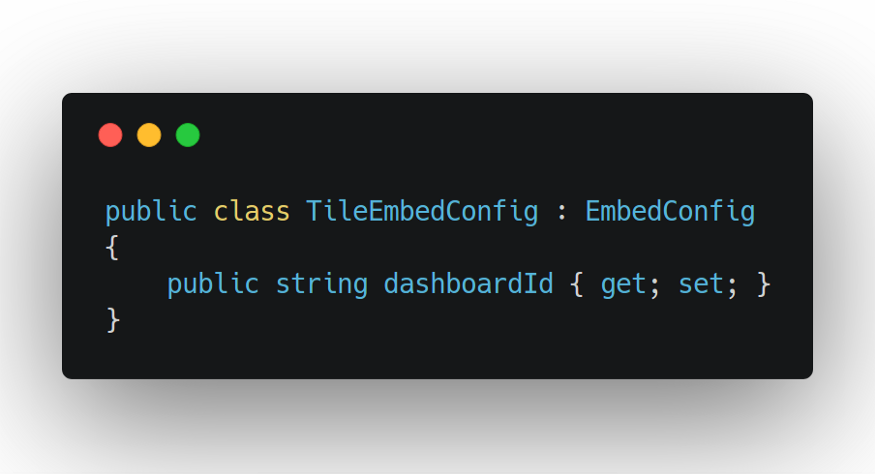 Token object for Tiles. Gist: https://gist.github.com/krishnaanaril/8d4960b06aeefa218886c959308974f6
We need to add Microsoft Power BI client library as we are invoking Power BI API’s from the server side code.
As API methods, I’ve created three methods for Reports, Dashboards and Tiles respectively.
-
GetReportEmbedToken— This method accepts two optional parameters, username and roles, which is used for enabling row-level security (RLS). You can find more info about RLS here. In the method, we are returning the embed token for the first report available in the workspace.
-
GetDashboardEmbedToken— This method returns the embed token for the first dashboard in the workspace.
-
GetTileEmbedToken— This method returns the embed token for the first tile in the first dashboard which is available in the workspace.
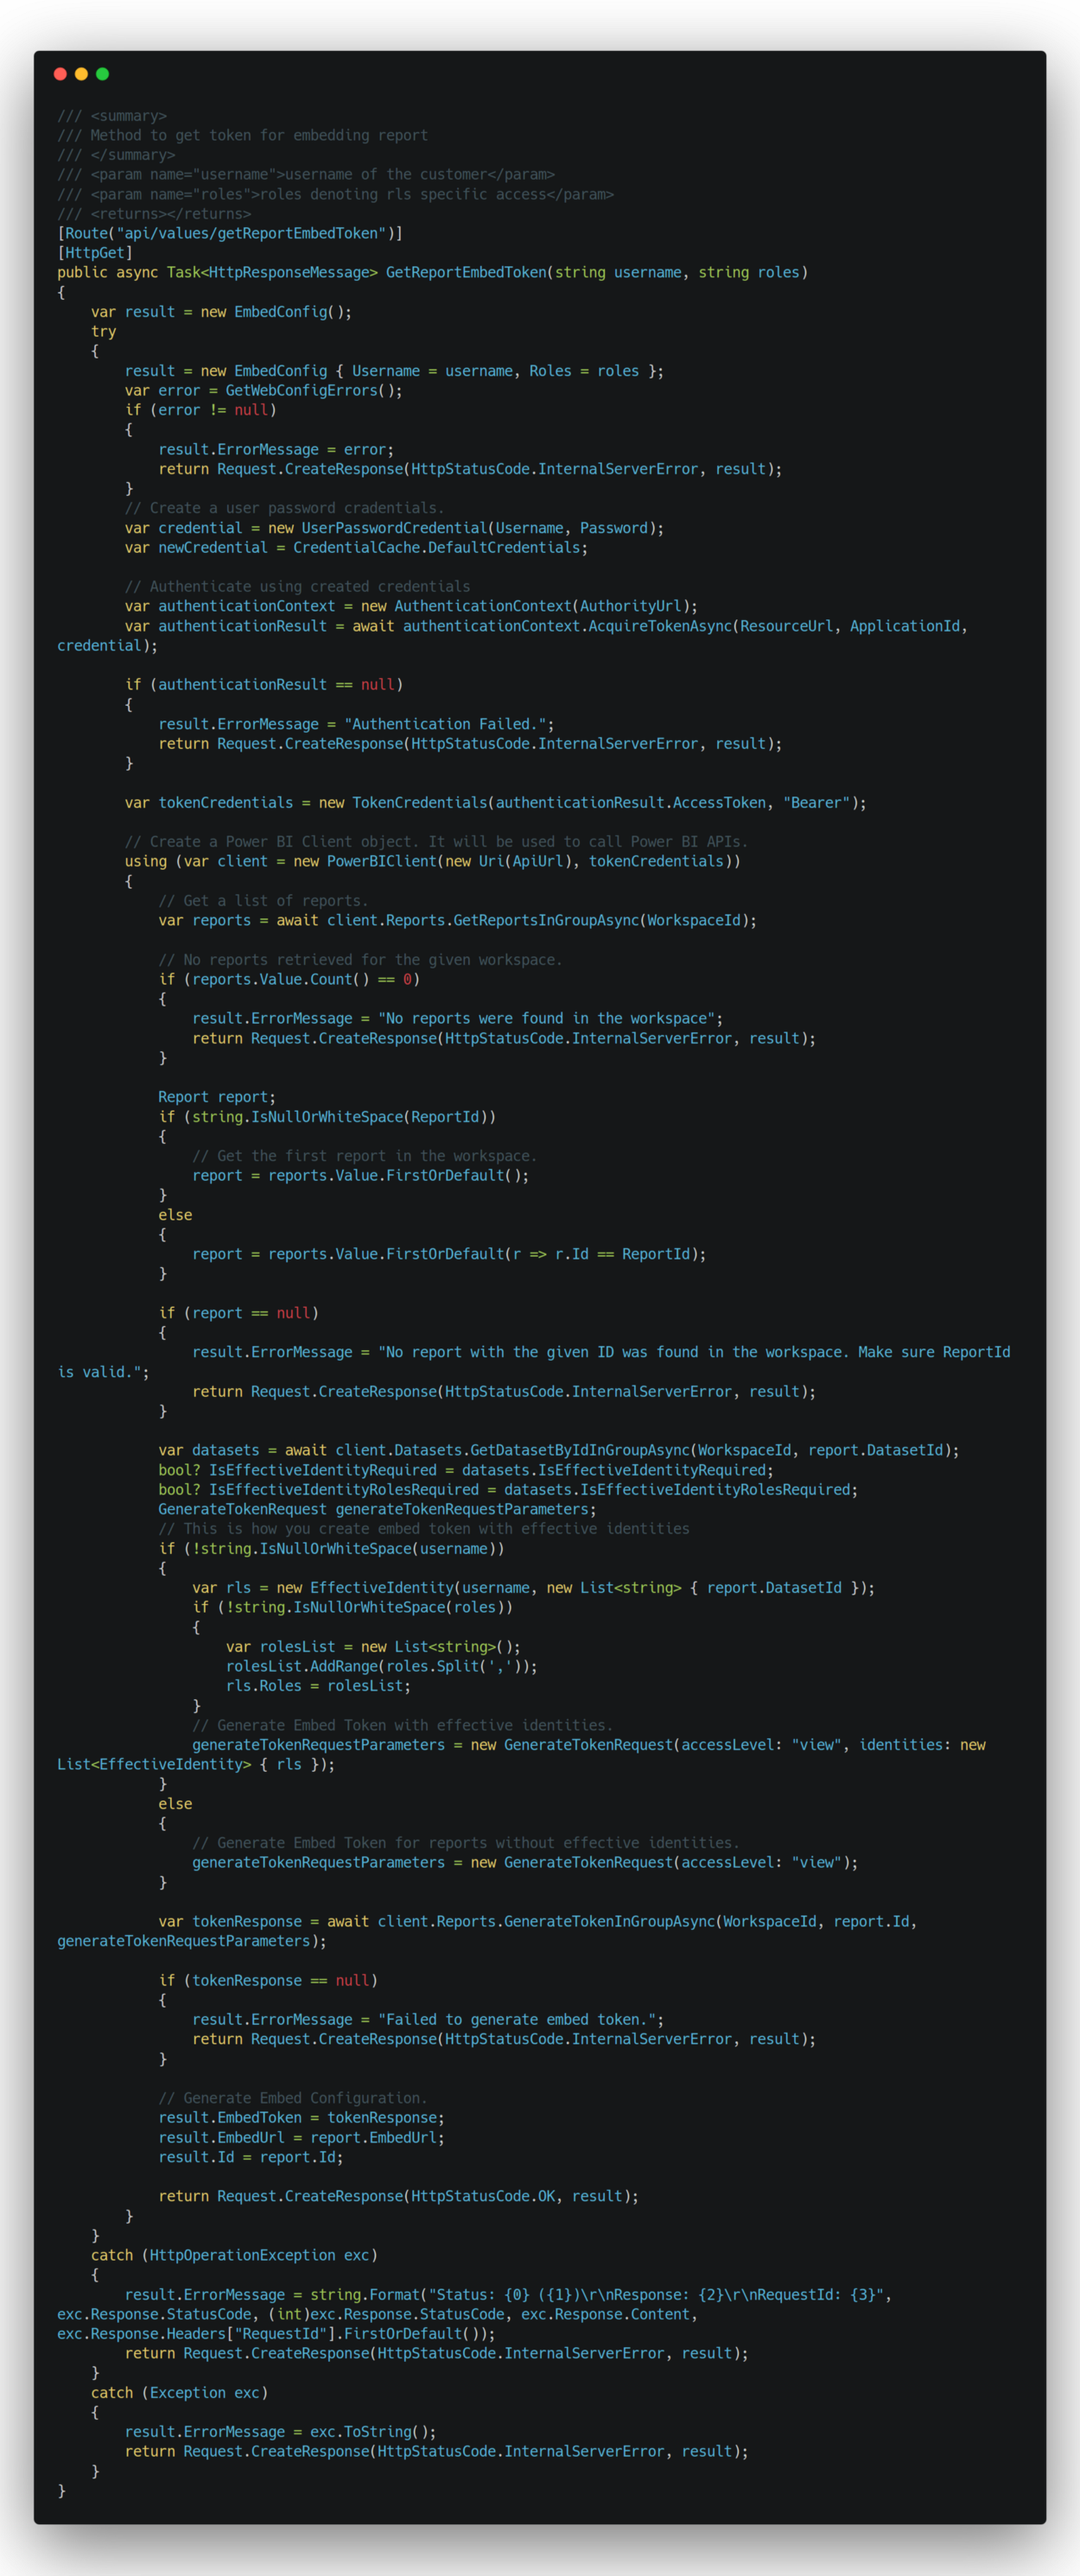 API method for getting embed token. Gist: https://gist.github.com/krishnaanaril/b093ab817d8fc29e4096346e034ccf3f
You can extend this methods to return tokens for custom reports, dashboards and tiles.
Create Angular client
Here we need to create a service to call the API we created above. For that, let’s create a service and add the following method.
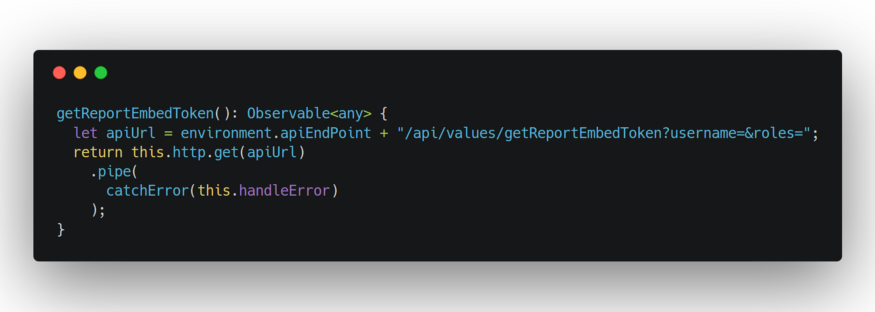 Gist: https://gist.github.com/krishnaanaril/2387fa2a7fb2746cf1b0d93c149f03a9
In the HTML page, create a ‘div’ with id ‘embedReport’. We’ll be showing report in this div. Embedding in div is done using Power BI JavaScript library. You can add it to your angular application by running the following command.
npm install --save powerbi-client
Next, we need to create a method in component class to embed the reports as follows.
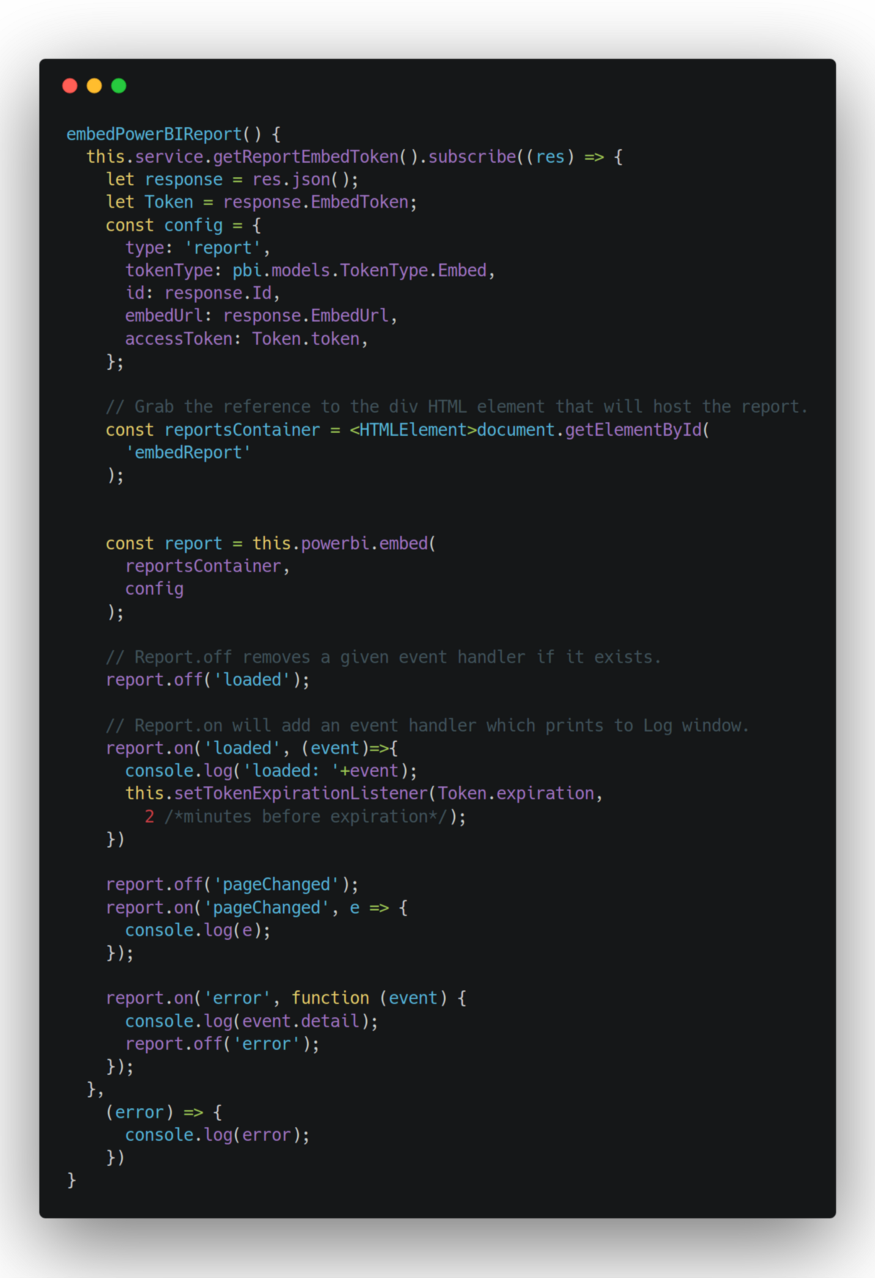 Gist: https://gist.github.com/krishnaanaril/412001afccf2f74d1c840e1f7fb4b7fe
For embedding reports for customers, type should be ‘reports’ and token type should be ‘Embed’. Here you can see the code for ‘tokenExpirationListener’. This is added as the generated tokens are valid only for an hour and it expires after that. So we need to generate another token by that time and update it. More info can be found here.
Conclusion
Now you’re done with your Angular app and its corresponding Web API, run it and verify the reports.